New world map catches the biggest polluters
In order to be able to better counteract climate change, it is important to know who is responsible for greenhouse gas emissions. A corresponding world map now provides a global overview.
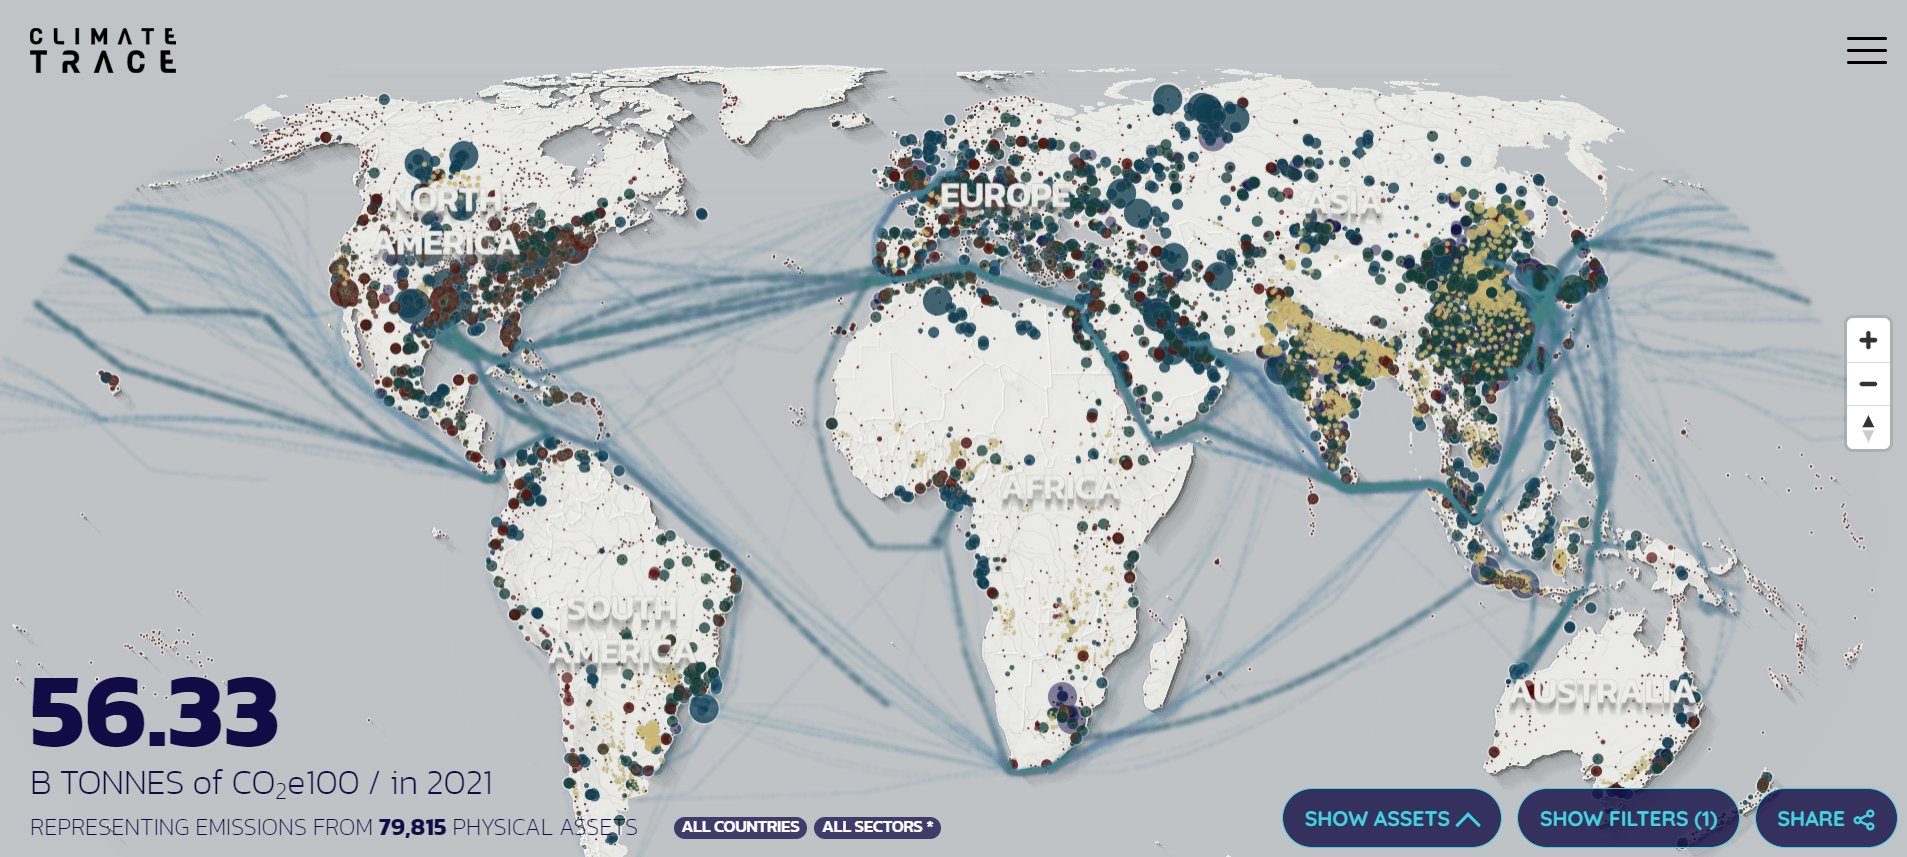
World map for greenhouse gases
Natural disasters, a summer that is too hot and an autumn that is too golden – these are just a few of the effects of climate change, which has been fought for so long. But it is not easy to find the global trouble spots. The initiative Climate Trace now wants to ensure more transparency.
The US non-profit organization, whose founding members include former US Vice President Al Gore, has a free world map programmed that shows how many Greenhouse gases in different countries of the world are produced (source: NPR.org). These include airports, power plants, oil refineries and much more. so far will over 72,000 locations tracked by the initiative, but the goals are ambitious: millions of locations are to be listed over the course of the next year.
In order to calculate the emissions, among other things, over 300 satellites, sensors on ships, airplanes and on land and intelligent modeling programs worked. Thus, the initiative for its work is not dependent on the information provided by the respective company. Al Gore also emphasized this to NPR: “Fraud is not possible with this method of artificial intelligence because several data sets would have to be falsified somehow.”
He also stated that the records made it clear that many companies in the gas and oil sector report emissions that are 3 times lower than they actually are. The map is therefore not only a useful overview for private individuals, but should also be used in the politic and economy (in the sense of cooperation with other companies) serve to clarify.
Even small changes can save electricity and gas. We give you some tips in our articles:
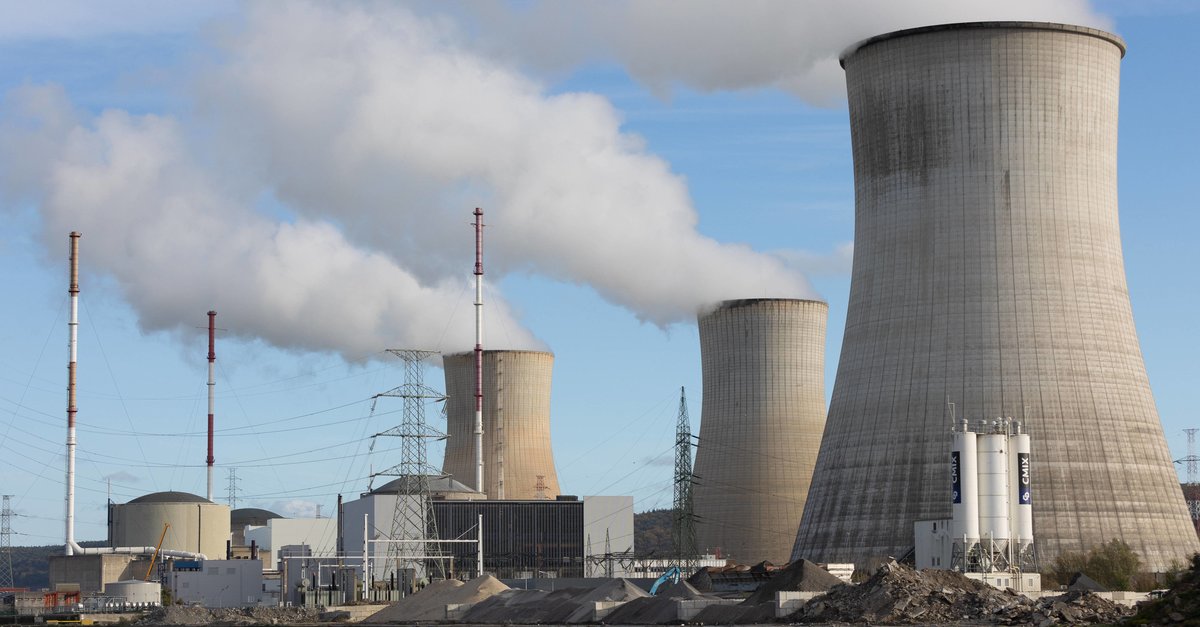
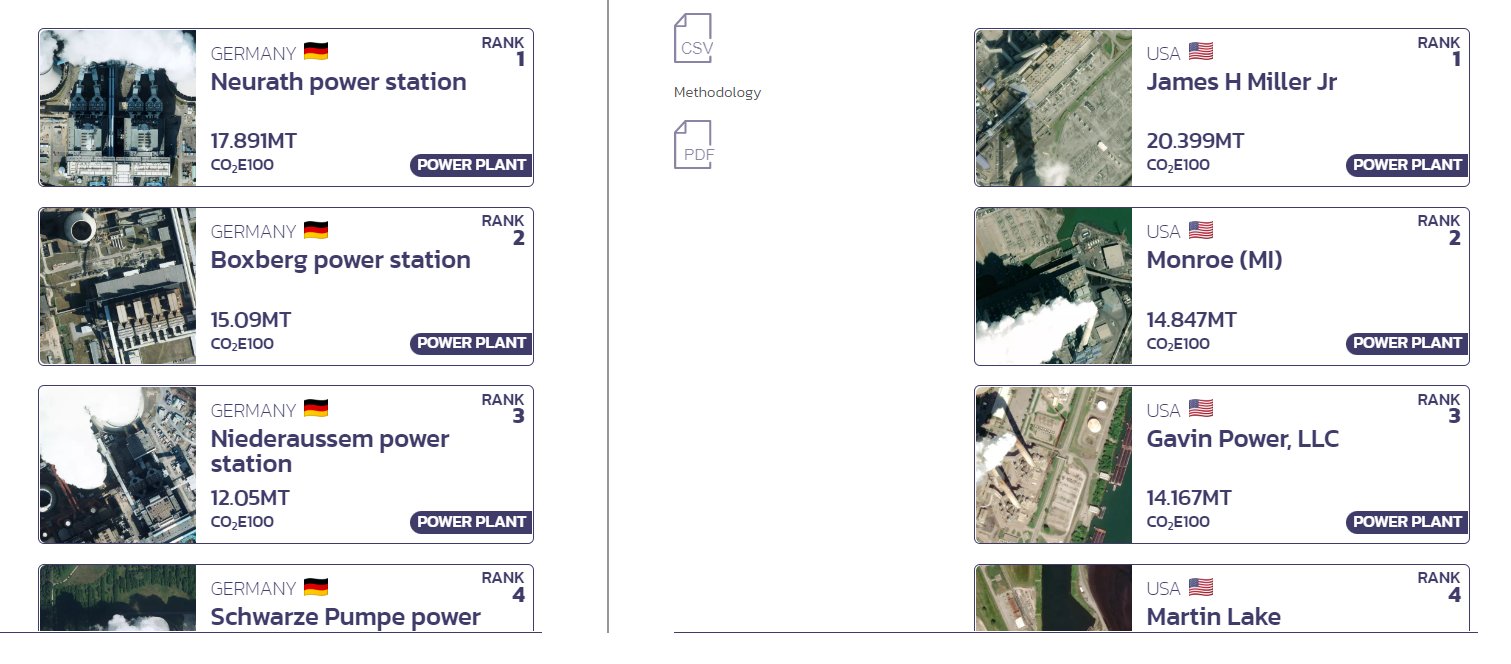
Power plants are number 1 in Germany
Also the Emissions in Germany are comprehensible on the world map. The power plants in particular are at the forefront: the Neurath site emitted almost 18 megatons (i.e. 18,000,000 tons) of greenhouse gases in 2021, while in Boxberg it was over 15 megatons. In third place is ThyssenKrupp with its steelworks in Duisberg, which was responsible for over 13 megatons of greenhouse gases last year.
Compared to China, however, that is almost little: the gas field in Sulige pumped almost 81 megatons of CO last year2 in the air. The oil and gas refinery in the US Permian (Texas) bumped into this 208 megatons of CO2 into the atmosphere.
Are you interested in a direct comparison between countrieswill give you a tool on the website offered. So you can see at a glance how many emissions are emitted in Germany in a certain sector compared to, for example, the USA.
With the map, Climate Trace makes the actual actions of different sectors and companies visible and brings more reality into the numerous promises of the same. The influence on climate change, both positive and negative, can thus be better understood in the future.