4 AI tools to build your presentations in no time
Creating presentations is exhausting, detailed work. Something should be possible with AI tools today, right? We played with our media data and tried to create a classic sales pitch presentation for potential advertisers with the help of AI. We primarily tested those who offer a free test account.
So much in advance: All tested AI tools still have room for improvement. No tool gave us an almost perfect presentation – all of them still require a lot of manual work.
Contents
SlidesAI as a Google add-on
SlidesAI must in Google Workspace to be installed and is then available on Google Slides. Under Extensions you will then find SlidesAI, where you have two options: adapt existing slides or build a new presentation with the tool.
For this, owners of a free account can enter a maximum of 2,500 characters, for more a subscription must be taken out. The Pro subscription for 11 euros a month allows you to enter 6,000 characters, while the 12,000 characters for just under 22 euros a month. The upload of documents is announced for both payment models. There are a few designs to choose from and rudimentary customization.
Then the AI actually spits out a few slides. We didn’t notice any major differences between the sales and educational versions in the test. In contrast to complete web apps, SlidesAI acts within Google presentations and accordingly creates unspectacular documents. After all, they are easy to adapt: images can be easily exchanged with an image search in the common stock photo libraries. Inserting the corporate design remains just as exhausting as before.
SlideAI just needs a Google Workspace. (Screenshot: SlideAI via Google Presentations/t3n)
What is confusing is that the tool gives instructions not to use the AI like ChatGPT. Content should be inserted explicitly, not instructions. However, the AI reformulates this content for the slides. If the text is already written in the incendiary voice, it will be lost through the use of AI, and this needs to be improved. The text that emerges at the end is, at least in German, interchangeable and generic presentation text like from school.
There is also an add-on for Google Presentations Magic slides. This looks very similar to the video demonstrations after SlideAI.
StoryD is a web app with a slightly different claim: presentations should not only be created, but the facts should be processed on storytelling basics. This even works a bit: In contrast to SlidesAI, which actually only outputs bare language, it works more creatively with formats and language. StoryD also works in German.
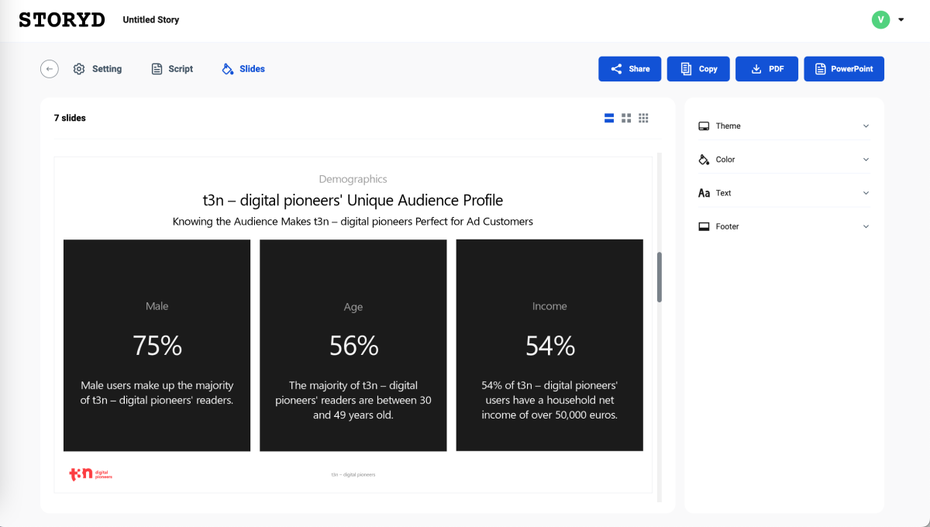
StoryD prepares the data in a completely different way – but major adjustments have to be made elsewhere. (Screenshot: STORYD/t3n)
Before creating the slides, StoryD provides a script that can be edited. In it, the tool divides into a basic situation and a villain that the hero, our product, can defeat. Once the presentation has been created, the editing options are minimal: changes can only be made to colors, fonts, footers and the theme. For everything else, including text changes in the slides instead of the script, the file has to be transferred to PowerPoint.
Gamma is officially only available in English, but it responds to German commands and can translate English content on slides into German. As a separate web app, the tool has more creative freedom – which it also fully savors. The problem: The slides do not adhere to the usual screen size ratios. If you don’t adjust them, you will face a strenuous presentation situation in which you have to scroll and jump with arrow keys. Even so, the forms of representation are refreshingly different, creating a timeline is fairly easy. Processing is done via a chat interface.
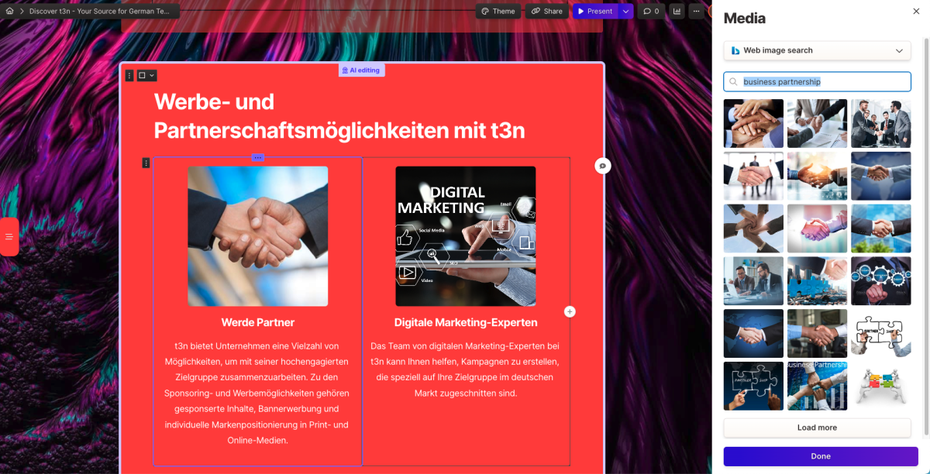
On the right, where there is now an image search, is the chatbot for editing the presentation. (Screenshot: Gamma/t3n)
But beware: the tool does not have many input options. Like ChatGPT, it creates texts on its own. Which meant in our media data case: Gamma came up with a lot. Supposedly we have an “Insights” product and want to expand to South America and Asia. So always check and adapt the texts!
Decktopus has a similar structure to the other tools: in advance there is a small form in which the topic and goals are defined. As with all others, the generated presentation still needs to be adjusted in terms of branding, tone of voice and information. A big advantage of the tool, however, is that it produces graphs. There is not much to see on these and the numbers are not correct – but with a click on them the axes, which in this case show KPI and their values, can be adjusted. The diagram then updates itself automatically. Where it might fit, it also builds in table suggestions that are just as easily customizable.
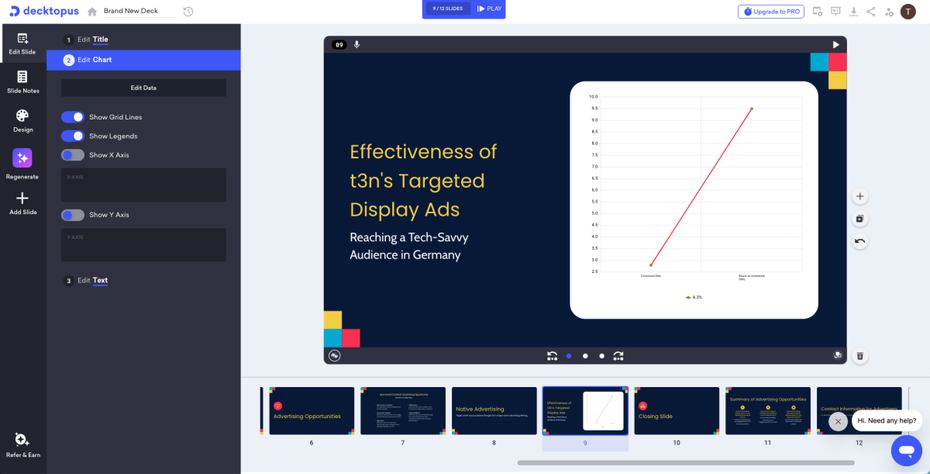
Including functional graphs – that’s own initiative. (Screenshot: Decktopus/t3n)
If you want, you can also text the slide notes directly on Decktopus. Decktopus also responds in German if you address it in German.
Ultimately, the tools help to make it easier to build a framework that is then adjusted. Images are easier to share, and most tools allow stock photos to be searched directly without switching tabs — let alone having to download an image. Decktopus has even built graph dummies that are easily customizable with your own data.
The detailed work then lies in (re)creating a tone of voice and designing the foil in the brand look. In addition, most of the tools only speak English – but here it is worth trying out German.
A document upload and specific command options are missing everywhere. Colleagues have suggested example requirements for presentations to test; neither of these was possible. The tools currently leave a lot to be desired, especially when it comes to correct reporting. On the other hand, the same applies here as with any AI: caution is advised against feeding the AI with internal data. We used the media data for this purpose, which can be viewed anyway.
Basic tip: do without AI-generated image creation. It makes more sense to use stock photos and graph dummies to create placeholders and adjust them manually – otherwise the AI will create graphs. And they look like this:
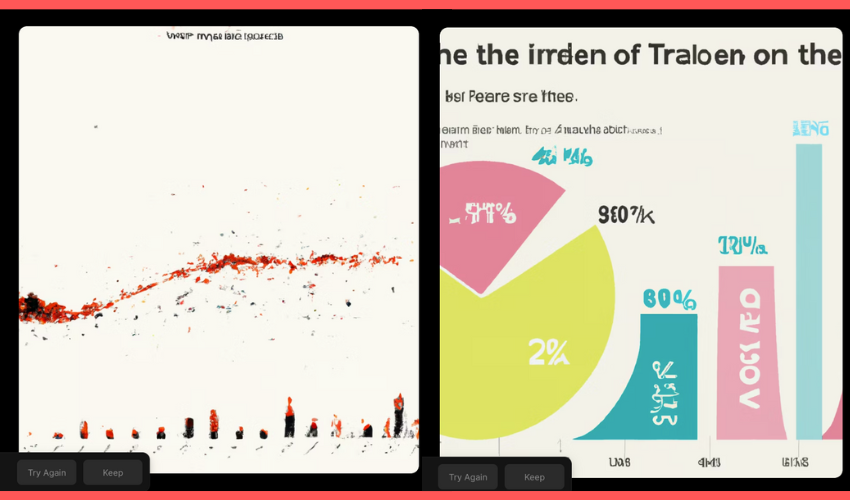
The Tome tool created these charts and invented our new magazine, Tegea Tones New. (Screenshots: Tome/t3n)