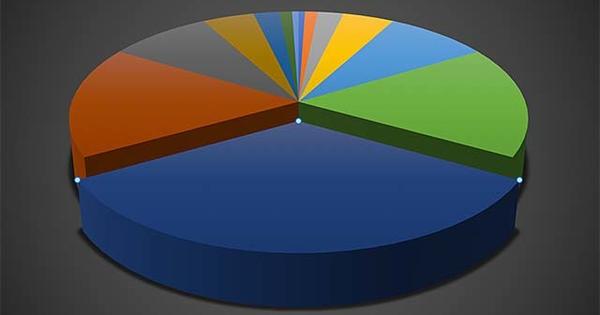
This will give you an overview in your Excel charts
A table of figures is usually difficult to interpret, which is why we like graphs that provide insight at a glance. Yet it is tempting to create complicated and overwhelming graphs in Excel, while it is of course about clarity. How do you choose the right type and how do you create convincing, beautiful Excel charts that are easy to read?


