
Synergy effects in online marketing with Microsoft Power BI
The assessment of synergy effects from online marketing campaigns is often based on gut feeling and speculation. That can be solved – with combined forecasts.
Many companies want to know what realistic results they can expect from digital advertising and marketing strategies. That is understandable, because nobody likes to buy a pig in a poke. It’s about predictability and predictability, especially when marketing budgets are redistributed and their weighting needs to be planned for the best possible use in the coming year. Here, however, the process in teams and agencies is often designed in such a way that individual figures and assumptions based on them are discussed rather than data-based assessments.
There are pure sales and conversions – but how are UX improvements reflected in the conversion figures? How specifically have social media activities affected the business? What is missing for a successful company presentation is a modular, combined forecast that at least covers the development and synergy of the most important factors. It goes without saying that future developments cannot be precisely predicted with this – but we come within a realistic frame of reference.
Contents
Initial situation: calculate conversions
The calculation of conversion developments and their causes is the central subject of interest for most corporate executives. It depends entirely on you which conversion events are actually given in your starting position. If you count pure direct inquiries or purchases as hard conversions, and webinar registrants for example for entering the sales funnel as soft conversions, it is advisable to show these two conversion types in separate graphs. In the end, however, it is purely a question of stylistic design. Any solution can be used for forecasting itself, such as the forecasting function of Microsoft Power BI, which is used for the following examples.
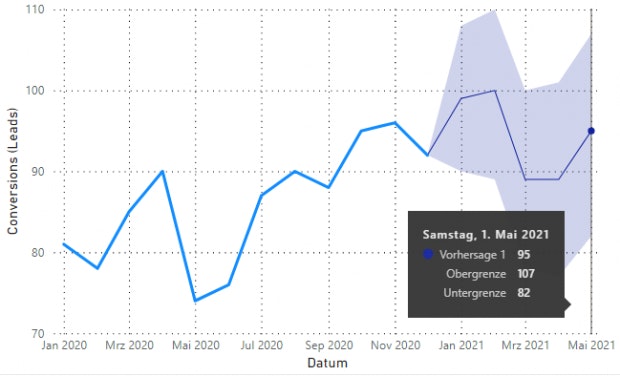
example: Conversions through ads with a new customer strategy in the case of constant optimization
Forecast via Microsoft Power BI with a confidence interval of 75 percent (upper limit / lower limit). (Screenshot: Slava Wagner)
Example: Organic inventory development of conversions
Forecast via Microsoft Power BI with a confidence interval of 75 percent (upper limit / lower limit). (Screenshot: Slava Wagner)
Based on the forecasts, we can now add modular synergy effects. Depending on whether you offer upsales in the B2B area or other products or product types in the B2C area, the rate for the conversion of new customers can be added. This means that you can calculate the percentage of new customers that will return after a year with an analytics software of your choice. So if you see that on purely organic landing pages the total number of returners rose by 30 percent per year, while on advertised landing pages with a new customer strategy by 50 percent, it can be assumed that many new customers have returned here. You can offset the difference with the conversion rate of the respective landing pages and include it as a key figure for further forecasts.
Example: Organic inventory development of conversions with a five percent example increase through organic, recurring users from a paid new customer strategy
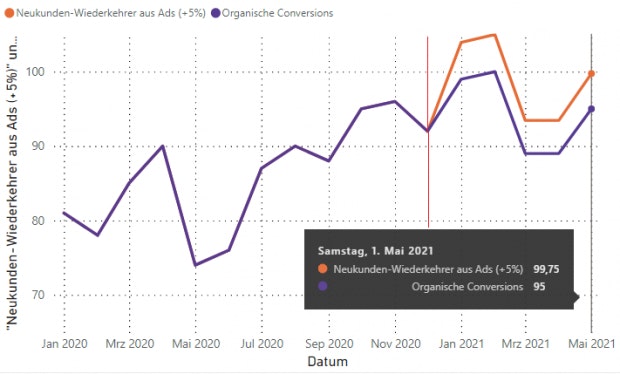
To the right of the red dividing line: forecast values. (Screenshot: Slava Wagner)
If you want to convincingly present the potential of a certain strategy, the following illustration is suitable. It clearly shows how much each channel brings in relation to the other and what one channel would be without the other. Additional metrics can optionally be added to this display: conversions from social media (Linkedin, Facebook, Instagram), organic and paid, conversions from mailing lists, or conversions from apps.
Example: Comparison and forecast of performance developments
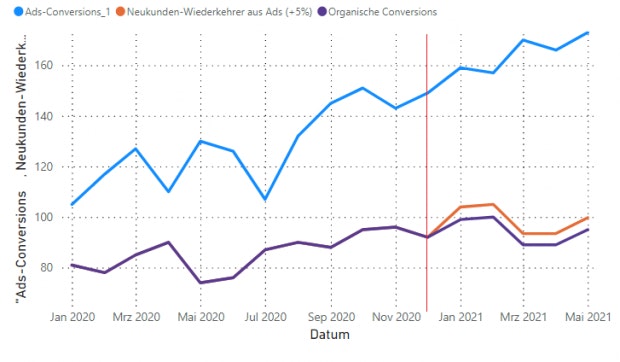
To the right of the red dividing line: forecast values. (Screenshot: Slava Wagner)
If we now add up all the values, we have a data basis on which we can forecast the maximum total potential of all channels. Now comes the last factor: Depending on the channel, we assume a roughly stable conversion rate on the landing pages. If you run website A / B tests here (with Google Optimize, Hubspot or a manual approach) and find a better converting website version, then you should add the improved conversion rate to the total calculation.
Example: Overall forecast of all conversions with a five percent increase in conversions due to an improved conversion rate
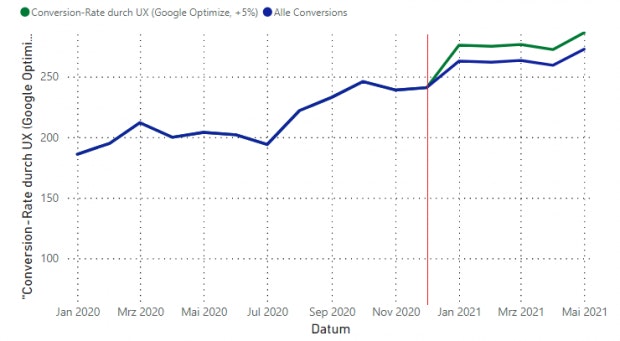
To the right of the red dividing line: forecast values. (Screenshot: Slava Wagner)
Done: Now we have an overall forecast that shows the company’s realistic, maximum technical ad hoc potential. The message in this example would be: If we don’t advertise or expand our SEO, we will stay on the bottom line. Additional measures would be UX optimizations through website A / B tests.
Example: Final overall forecast
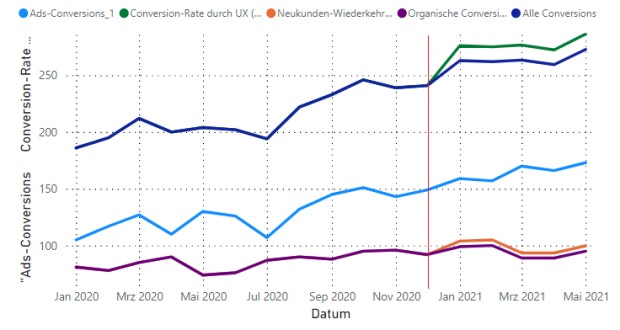
To the right of the red dividing line: forecast values. (Screenshot: Slava Wagner)
With this process technology, you can extrapolate developments from campaigns for months or years to come. It should be noted at this point that positive trend developments cannot be exponentiated indefinitely: the number of customers, impressions and market shares are of course finite. Therefore, a certain amount of operational experience is required for a realistic assessment.
Overall, the process is particularly suitable for marketing teams in companies or for marketing agencies that can provide their customers with exciting reference values. The offsetting of synergy effects and the forecasting function also impress with their traceability and provide the ideal basis for argumentation for the implementation of new measures, strategies and campaigns.
“A confused mind always says no” is what it says with regard to decisions of all kinds – with this procedure a lot of confusion can be cleared up, so that the responsible decision-making bodies can be convinced of a yes to new, functioning approaches through clarity.

Slava Wagner is an online marketer specializing in technical target group analyzes and digital advertising for companies and organizations in various industries. He works in the marketing agency environment in the Berlin-Brandenburg area.